Founder, Masters in Trading
Venturing into the exciting and multifaceted realm of energy markets is like embarking on a treasure hunt. You’re always on the lookout for hidden gems that offer fresh insights and profitable trading opportunities.
Today, we’re offering you a map to two such gems: the crack spread and the spark spread. So buckle up, and let’s dive deep into these powerful indicators that can revolutionize your analysis and trading strategies in the energy sector.
Cracking the Code: Understanding the Energy Spreads
The crack spread serves as a compass in the volatile world of energy trading. It signifies the price difference between crude oil and its refined products like gasoline and heating oil. This price differential between primary crude oil and refined products is a critical metric for the oil refiners, traders, and investors. After all, these differentials offer crucial insights into refining operations and oil refineries’ profitability. These differentials, in turn, help us make informed decisions within the energy market.
Monitoring the crack spread is like keeping a pulse on the energy market. This market signal empowers stakeholders to evaluate refining strategies, optimize oil production further, enhance refining margins, and sell refined petroleum products effectively. All of these factors help the industry manage profit margins.
The crack spread ebbs and flows based on a multitude of factors that shape the supply and demand dynamics of crude oil and refined products prices. These include refining capacity, transportation costs, market expectations, and the overall state of the crude oil and refined product markets. By analyzing these factors, refiners can assess their competitiveness and profitability within the industry.
The spark spread, on the other hand, revolves around electricity generation from natural gas. It signifies the difference between electricity prices and natural gas costs. It’s a crucial metric for power plant operators, investors, and energy traders as it helps measure the profitability of electricity production. The spark spread is also influenced by natural gas price fluctuations, supply and demand, weather conditions, and geopolitical events.
By understanding the nuances between the spark spread and the crack spread, the energy market can tailor their strategies to suit the specific dynamics of each spread. They can use the spark and crack spread means to evaluate electricity generation projects’ profitability and monitor the impact of natural gas prices on the market. Simultaneously, they can analyze the crack spread to gauge refining operations’ profitability and adjust their strategies in response to changing market conditions.
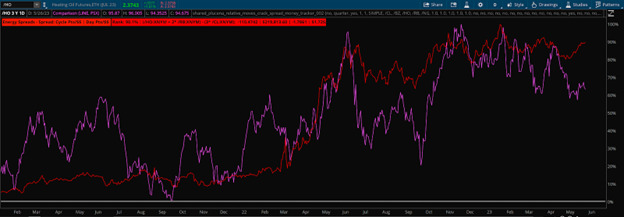
Crack Spread Relative to Refinery $PSX
Crack Spreads: The A to Z
When the stock market talks about crack spreads, it’s like opening a window into the energy industry – specifically, a barrel of crude oil and refineries. Crack spreads are like a thermometer that measures the profitability of turning crude oil into useful, refined petroleum products (gasoline, diesel fuel, heating oil, and more).
Let’s simplify this!
The 3:2:1 Crack Spread: This crack spread ratio is like a recipe that shows how much gasoline and heating oil we can cook up from:
- One refined product futures
- Three crude oil futures per barrel of crude oil
- Three barrels of crude oil
Let’s suppose gasoline costs $2.50 per gallon, heating oil costs $2.00 per gallon, and crude oil is priced at $60 per barrel. We can calculate the 3:2 crack spread as it widens to:1 crack spread per barrel of gasoline. The following is the ratio we use to join all these figures:
3 x $2.50 – 2 x $2.00 – $60 = $1.50
The 5:3:2 Crack Spread: This recipe shows how much gasoline, fuel oil, and diesel we can concoct from:
- Five barrels
- One barrel of crude oil
- One barrel of oil and two barrels of oil
Assume gasoline costs $2.60 per gallon, diesel costs $2.20 per gallon, and crude oil is priced at $65 per barrel. We can calculate the 5:3:2 crack spread per barrel of gasoline as follows:
5 x $2.60 – 3 x $2.20 – 2 x $65 = $7.00
Other Crack Spread Recipes: Depending on the products we want to make and the market situation, we use the crack spread for different recipes and multiple products. For instance, the Jet Crack Spread helps us calculate the profitability of turning a barrel of crude oil into jet fuel, and the Propane Crack Spread calculates the difference between the prices of barrels of gasoline, propane, and crude oil.
Crack spread formulas are like the GPS of the energy market. They guide us towards understanding the profitability of refining crude oil, and they help us make informed decisions in the stock market.
Harvesting Hidden Opportunities: Trading with Crack Spread Insights
In the exciting world of energy trading, players don’t just seize the day… They seize opportunities. And one secret to their success lies in understanding and harnessing the power of the crack spread. This metric offers crucial insights into the energy market’s pulse, guiding traders to optimize positions, capitalize on market inefficiencies, and uncover pathways to robust returns.
For the inquisitive energy trader, the crack spread becomes a beacon, illuminating the path to intelligent crude oil futures and production strategies, astute investments, and dynamic trading. By keeping a watchful eye on this spread, they can decode the mysteries of crude oil price and differentials while tapping into profitable exploits in crude oil futures and markets.
As we journey further into the world of crack spread analysis, we’ll explore how this vital tool impacts commodity prices, highlights opportunities for refiners and investors, and forms the bedrock of strategic decision-making. So, fasten your seatbelts as we delve deeper into the fascinating world of crack spreads to unlock their profound potential for energy market success.
Unlocking the Power of the Spark Spread
The Ultimate Decoder: Understanding the Spark Spread
Just as the crack spread serves as a lynchpin in the oil market, the spark spread holds court in the electricity generation sector. It reflects the difference between the revenue generated from electricity and the cost of the natural gas used to produce it. This shows us the pricing difference in the gross margins and hints at the profitability for power plant operators and energy traders.
As the chess pieces of electricity prices and natural gas costs move, the spark spread becomes a reflection of their game, revealing their interplay’s impact on power generation profitability. By decoding the spark spread, market players can gain crucial insights into power generation operations, allowing them to make decisions backed by data and understanding. As a result, the spark spread allows market players to carefully gauge the profits in generating this ever-essential product.

Diving into Factors Shaping the Spark Spread
Just as the winds of different directions shape the ocean’s waves, numerous factors influence the spark spread. These include fluctuations in the price of crude oil and natural gas prices, supply and demand dynamics, weather patterns, and geopolitical events.
The spark spread dances to the tunes of crude oil and natural gas prices. As these commodities experience price volatility, the costs of selling gasoline futures and generating electricity change, impacting the barrels of gasoline futures and the profitability of power plants.
Supply and demand dynamics are another significant choreographer of the spark spread’s movements. Shifts in electricity consumption or disruptions in natural gas supply can significantly reshape the spark spread. Weather conditions, too, play their part lock in part by affecting electricity demand and natural gas costs.
Geopolitical events – such as political instabilities in energy-producing regions or changes in energy policies – also send ripples through the market signal spark spread. Market players, thus, need to keep a keen eye on these variables to anticipate and respond to profitability changes in electricity generation.
Deciphering the Crack and Spark Spreads: Two Different Stories
The crack and spark spreads, while similar in essence, operate in different arenas and serve different purposes. The crack spread focuses on the fuel oil sector, dealing with the differential between the price of crude oil and its refined products. In contrast to fuel oil itself, the spark spread revolves around the electricity generation sector, where it tracks the difference between electricity prices, fuel oil, and natural gas costs.
For power plant operators and energy traders, the spark spread is a pivotal tool. It gives them a peek into the profitability of power generation, helping them make informed decisions about managing production levels, cost considerations, and investments in facility upgrades.
On the other hand, the crack spread primarily concerns the pricing difference between the oil refiners, traders, and investors in the various per barrel of crude oil and its derivative products. It aids in refining strategies, gauges profitability, and guides trading decisions related to crude oil prices.
By understanding the nuances between the spark spread and the crack spread, market players can effectively utilize these as complementary decision-making tools. These spreads allow them to fine-tune their strategies to the specific dynamics and requirements of their respective energy sectors.
Capitalizing on Trading Opportunities with Spark and Crack Spreads
Market players can utilize the spark and crack spreads as a compass, using historical data and trends to identify potential trading opportunities. Understanding the relationships between these spreads and external factors can provide vital insights into possible future price movements.
Using historical data and the product market as guides, traders can identify patterns and correlations between the spark spread, electricity prices, natural gas costs, and other significant factors affecting crack spread. Recognizing these patterns can unearth opportunities for profit by exploiting price differentials and market inefficiencies.
Implementing Strategies for Success
Spread trading and pair trading are among the strategies that traders can employ to capitalize on these insights. Spread trading involves positioning oneself based on expected spread and price movements, while pair trading capitalizes on divergences between related energy contracts.
Options and futures contracts tailored to the spark and crack spreads offer flexibility and risk management tools. These derivatives allow traders to hedge their positions, mitigate risk, and gain exposure to specific spread and price movements.
By employing these strategies and leveraging the spark and crack spreads, market participants can optimize their trading positions, make informed decisions, and seize opportunities within the energy market.
Exploring New Frontiers: Crack Spreads and Futures Trading
In the ever-evolving energy market landscape, innovation is key to gaining a competitive edge. The crack spread, with its wealth of insights into refinery valuation, is one such innovative tool. By understanding the dynamics of the crack spread and exploring trading strategies for crude futures, market players can unlock invaluable insights and make informed decisions.
Using the crack spread and futures trading can dramatically improve our ability to judge the best trading opportunities in the energy market. We just need to adapt and form innovative strategies to respond in a constantly changing energy market landscape.